
Photo Credit: Louise Docker
Each year brings warnings of drought and with it, the implementation of water conservation measures. How do climatologists know if a lack of precipitation is a drought indicator or simply part of the earth’s natural cycle?
In a word: Data.
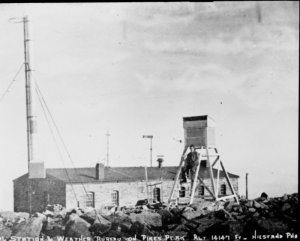
Pike’s Peak Weather Station Photo Credit: NOAA
Everything water related, including drought, begins with precipitation. Systematic weather reporting in Colorado began in the 1870s and 1880s, with the first weather reports coming from Pike’s Peak in 1873. In the late 1880s, the Colorado General Assembly passed legislation supporting the “Colorado State Weather Service” and in 1890, the U.S. Department of Agriculture took over climate monitoring and reporting. It was also in 1890 that the Cooperative Observers, a group of now more than 8,700 volunteers, began providing observational meteorological data in real time.
Today, precipitation in Colorado is tracked by a statewide network made up of the National Weather Service (NWS) and the Cooperative Observers. Together, they have set the standard for mapping and monitoring precipitation—recording the data that provides a history of precipitation across the state and thus sets a baseline for drought.
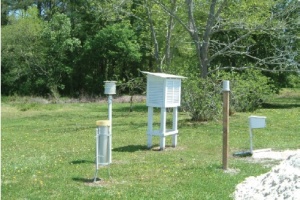
Cooperative Observer Station Photo Credit: NOAA
Currently, there are 200 to 250 weather stations in Colorado—some have operated continuously since the late 1800s. The longer a station has been compiling data, the better for revealing precipitation patterns and detecting abnormalities, which indicate something more serious. Still, a lack of data points across the state has kept climatologists from having a complete picture of Colorado’s precipitation.
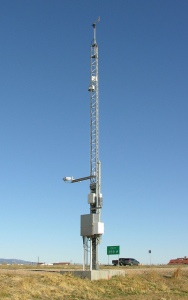
Photo Credit: Greg Goebel
Early on, data was not representative of mountain precipitation—a large part of Colorado—because gauges were primarily located in valleys, where the majority of people lived. With the help of the Natural Resources Conservation Service, data gaps were filled in the 1980s when they installed rain gauges in mountain forest clearings. Those mountain gauges improved coverage, but it was another 15 to 20 years before climatologists could establish a record that allowed them to truly understand Colorado’s climate.
With its vast size, it seems nearly impossible for there to be enough technology, information or data points to cover the entire state of Colorado. Tracking precipitation data has always been a time-consuming process. “When I started working here [Colorado Climate Center] in 1977, everything was done by hand,” says Nolan Doesken, Colorado State Climatologist with the Colorado Climate Center at Colorado State University (CSU). “Each week, we would receive the precipitation reports from around the state, add up the totals, plot them on a huge map, draw the contour maps and then write up a report.”
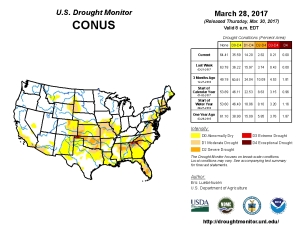
Photo Credit: USDA
Surprisingly, this hands-on approach continued until 2000, when computers were finally used for precipitation mapping. However, the use of technology comes with its own set of issues. “Creating a map by hand was a more intimate process,” Doesken acknowledges. “You were more likely to question outliers in data. With a computer, people are less likely to question the results. They trust the computer.”
Regardless of technological improvements, including the addition of weather satellites, there have always been, and still are, limitations to what technology can achieve. Some areas are difficult to reach for installing rain gauges, others have low populations or populations of people who are not interested in reporting precipitation data—fewer rain gauges means fewer data points from which to gather information.
“Weather satellites only tell part of the story,” says Doesken. “Radar might show that precipitation is falling in a particular area because it is collecting information from 12,000 feet above a field; however, that rain is evaporating before it reaches the ground. We need data from the ground level to see the whole picture.”
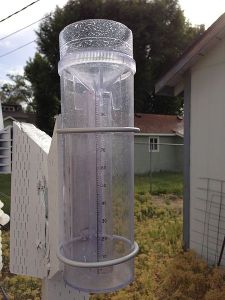
Rain Gauge Photo Credit: Famartin
The 1997 Fort Collins floods revealed that rain gauges were not showing the variability of rain and snow across the state; the heaviest rainfall leading up to the flood missed all of the official gauges, creating a situation where city officials were unaware of what was coming. This weather event resulted in the creation of The Community Collaborative Rain, Hail and Snow Network (CoCoRaHS) in 1998; a way to improve the quality of precipitation data, both locally and internationally.
CoCoRaHS is comprised of a community of volunteers ![]() dedicated to monitoring precipitation in their own, literal, backyards. After collecting precipitation data—rain, hail and snow—volunteers send their results to CoCoRaHS. Where there are more volunteers, there are more data points. Increased data points result in comprehensive data. CoCoRaHS volunteers cover gaps where there are no other weather stations and provide ground-level information that cannot be gathered by satellites.
dedicated to monitoring precipitation in their own, literal, backyards. After collecting precipitation data—rain, hail and snow—volunteers send their results to CoCoRaHS. Where there are more volunteers, there are more data points. Increased data points result in comprehensive data. CoCoRaHS volunteers cover gaps where there are no other weather stations and provide ground-level information that cannot be gathered by satellites.
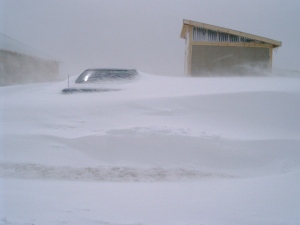
March 2003 Blizzard, Evergreen Photo Credit: NOAA
Data collected by CoCoRaHS members during Colorado’s historic March 2003 blizzard proved to be invaluable. “Volunteers did a fantastic job of monitoring precipitation,” Doesken exclaims. “Without their data, we would not have known that there was a hole in the storm, just over Lyons, Colorado. The town was surrounded by areas receiving several feet of snow, while Lyons received only 2 to 3 inches. We never knew what we were missing before!”
As methods for precipitation data collection continued to improve, it became clear that past methods of determining drought were woefully inadequate. In the late 2000s, the National Oceanic and Atmospheric Administration’s (NOAA) National Integrated Drought Information System (NIDIS) came online and a clearer picture of drought emerged.
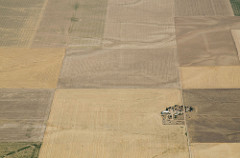
Photo Credit: USDA
When the USDA started using NIDIS to determine if certain counties qualified for drought relief, Doesken and his coworkers were forced to acknowledge that their picture of drought was incomplete. “We discovered that our assessments of drought were crude,” Doesken says. “In reality, we probably don’t get drought depiction right. We realized that we needed to be doing a better job of depicting drought on a local level, particularly on the Eastern Plains.”
Photo Credit: USDA
They discovered that drought is far more locally dependent than they originally thought. For example, in Phillips County—a population of 4,356 and an area of 688 square miles—drought is reliant on something as simple as a farm’s location in the neighborhood. While one farm has plenty of water, the next farm over is experiencing a drought. Without data proving that the farmer is experiencing drought, grants and loans that provide drought relief will not be available to them.
Photo Credit: Ken Lund
Precipitation across Colorado has been monitored for more than 100 years. The data collected has helped climatologists determine the risk of drought which allows policymakers to plan for the future. While the system is imperfect, weather satellites and radar have improved, and on-the-ground data collection has increased. We are learning where there are breaks in coverage and knowledge, providing the opportunity for further improvements and a better understanding of how precipitation and drought impact our state.
Collecting precipitation data informs the way that we plan for the future. Keep an eye out for the upcoming summer 2017 issue of Headwaters Magazine, which will focus on how water data can impact policy decisions, public safety, water conservation and our own personal behavior.
Not a Headwaters subscriber? Visit yourwatercolorado.org for the digital version. Headwaters is the flagship publication of the Colorado Foundation for Water Education and covers current events, trends and opportunities in Colorado water.
 Print
Print
Reblogged this on Coyote Gulch.